The physiological demands of endurance mountain running
Where does all the energy come from?
The two key demands of longer distance technical mountain races seem to be energy expenditure and muscular fatigue. A study by Ramos-Campo et al (2016) looked into the physiological changes and energy balance of experienced amateur athletes competing in a 54km mountain race. Their findings were:
Total energy expenditure was estimated at 5197Kcal with intake at 1493Kcal (3704Kcal deficit)
Serum markers for muscle damage significantly increased over the race
We now need to think about how we can manage the effects of these. Beginning with energy expenditure, we can look at how the body produces usable energy. This is the metabolic process. An amazing, if incredibly complicated infographic detailing these interlinked processes has been produced by the boffins at Stanford Medicine. It is more detail than is necessary but a cool thing to refer back to Pathways of Human Metabolism Map – Stanford Med Education.
As described on the diagram, the human body has many clever ways of providing us with usable energy in the form of adenosine triphosphate (ATP). Here’s a brief overview of the 2 key forms to know about:
Substrate-level phosphorylation (addition of a phosphate)
This works through the donation of a phosphate from one molecule to another, going from adenosine diphosphate (ADP, 2 phosphates) to ATP (3 phosphates)
Phosphocreatine and glycogen are two examples of substrates used
This form of metabolism does not involve oxygen and therefore is termed ‘anaerobic’
This is a very fast process producing a low yield of ATP
Oxidative phosphorylation
As this form involves the use of oxygen it is termed ‘aerobic’
This is a slower process producing a higher yield of ATP
Carbohydrates and fat may be used to fuel this
The most effective one to be used during exercise is determined by the intensity. It is a trade off between efficiency and rate of ATP (usable energy) turnover. For sprint events, the most important thing is to get usable energy fast. For this reason, substrate level phosphorylation is used. However, this method comes at the cost of increased acidity within the muscle and bloodstream (metabolic acidosis), causing a reduction in work-rate capacity and a need to reduce acidity within (buffer) the system to avoid bad stuff happening. Because of this, when exercise duration is increased this method alone is not sustainable and aerobic processes (oxidative phosphorylation) begin to dominate.
Increasing exercise duration and reducing intensity only leads to further domination of this aerobic pathway. Also, it impacts the fuel source used (Hargreaves & Spriet, 2020):
Sprint exercise
Anaerobic pathways dominate
Phosphocreatine
Glycogen
A race of approximately 1-minute
Aerobic pathways start to dominate
Glycogen stores in the muscle
Races of several minutes to hours
Aerobic pathways almost entirely dominate
Carbohydrate oxidation dominates, sourced from the blood and glycogen stores in the muscle
Fat oxidation, sourced from muscle triglycerides and blood plasma free fatty acids (FFA)
Races lasting longer than this
Aerobic pathways continue their reign of domination
As exercise intensity decreases, the relative contributions of fat and carbohydrate oxidation marginally shifts in favour of fat.
Here’s a good table to highlight the shift in contribution:
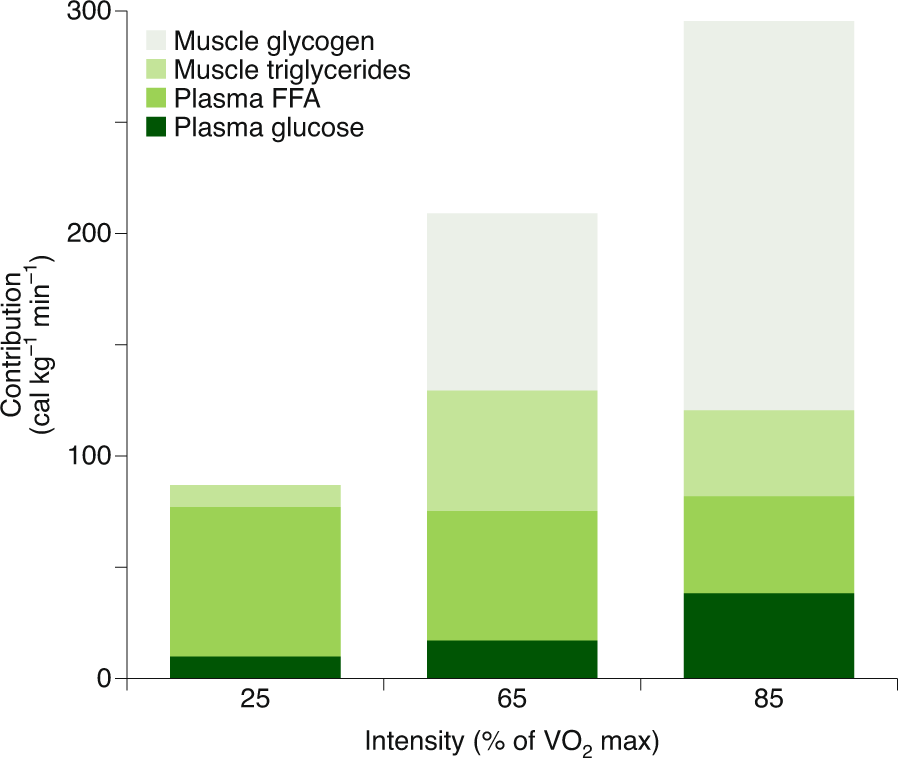
Figure 1. An adapted image take from The American Physiological Society (Regulation of endogenous fat and carbohydrate metabolism in relation to exercise intensity and duration - PubMed (nih.gov)) detailing the relative contribution of different fuel sources during varying exercise intensities. Taken from Skeletal muscle energy metabolism during exercise | Nature Metabolism
We now need to work out which intensities are required during endurance mountain races. A study entitled ‘Physiological demands of mountain running races’ by Rodriguez-Marroyo et al (2018) seems a decent place to do this. Within this study, they look at the time spent in 3 different key intensity zones for competitive amateur athletes during a range of mountain races.
To understand the zones used, you first have to understand a couple of terms:
Ventilatory threshold (VT) is the point during incremental exercise (gradually increased intensity) at which your respiratory rate increases to remove the excess Co2 that has begun to build up due to metabolic acidosis
This is still deemed ‘steady-state’ exercise as the body is able to buffer (reduce acidity within) the system
Respiratory compensation threshold (RCT) is the point during incremental exercise at which your respiratory rate moves into hyperventilation as you have moved beyond ‘steady-state’ exercise and metabolic acidosis is increasing faster than the body is able to buffer
With that, the zones used in the study are (Rodriguez-Marroyo et al, 2018):
Zone 1
Exercise intensity below ventilatory threshold (VT)
Zone 2
Exercise intensity between ventilatory threshold and respiratory compensation threshold (RCT)
Zone 3
Exercise intensity above RCT
With this in mind, these are the findings of the study:
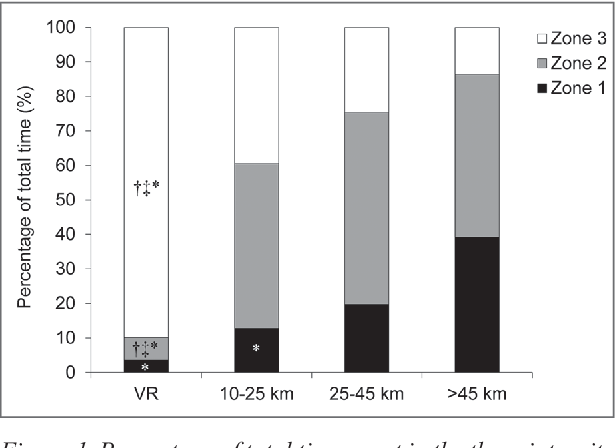
Figure 3. Results taken from Physiological demands of mountain running races | Semantic Scholar
Looking at figure 3 we can see that as the duration increases the relative intensity reduces. However, even when looking at the higher intensities (zone 2 and 3), we see that the total time spent within these zones also increases or remains equal as the race duration increases.
As we are looking into the endurance side of things, we can focus on the 25-45km and into the over 45km categories. For these durations, zone 1 and 2 dominate, with the added contribution of zone 3 and zone 1 shifting as duration increases. Therefore, it can be assumed that the predominant intensities to be adapted for lie below RCT, at times reaching even below VT. However, there is a small requirement for higher intensity and so some adaptation to this is needed.
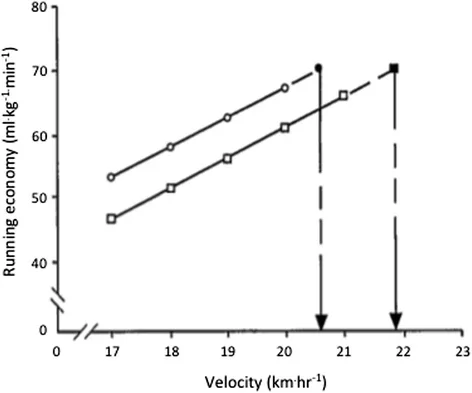
These intensities, for the participants of the described study, related to the following:

Figure 4. Taken from Physiological demands of mountain running races | Semantic Scholar
From this, and figure 1, we can make a good guess at the specific metabolic pathways used to meet the energy demands. Clearly the aerobic system (oxidative phosphorylation) dominates, with fuel sources being shared fairly equally (if slightly more contributed from fat) by a combination of fat (plasma FFA and muscle triglycerides) and carbohydrate (muscle glycogen). However, there is an element of anaerobic work that needs to be recovered from during the race, so adaptation here could also be important.
So, the focus is in optimising these systems, training to increase our capacity for oxidative phosphorylation of both carbohydrate and fat. Aspects to consider here are (Barnes & Kilding, 2015; ):
Increasing the size of the usable energy production engine
Vascularity (blood-flow)
Mitochondrial density (sites for aerobic respiration)
Myoglobin concentration (carriers of oxygen within the muscle)
Increasing the rate of fuel deliverance
Metabolic substrates
Fat
Muscle triglycerides
Plasma FFA
Carbohydrate
Muscle glycogen
Oxygen
Increased blood-flow
Increased haemoglobin concentration (carriers of oxygen in the blood)
Increased lung capacity
Doing so will increase our ability to meet higher energetic demands at the same relative work rate, leading to faster and more efficient movement! This appears to be a non-linear relationship, as shown by: Effects of individual aerobic performance on finish time in mountain running - PubMed (nih.gov).
The Ability to Move
A study by Lazzer et al (2012) showed 3 key factors that predicted 87% of the total difference in time completion between athletes during a fairly flat ultra-marathon. This is slightly different to the mountain stuff but gives a good idea for important trainable areas. The 3 factors were:
Vo2 max - The maximal rate of oxygen consumption achievable during exercise
higher the better
Fractional utilisation of Vo2 max - The proportion of your Vo2 max that can be sustained for the duration of the event
Higher the better
Energy cost of running
The energy required to move a specific distance for a given body weight and running speed
Lower the better
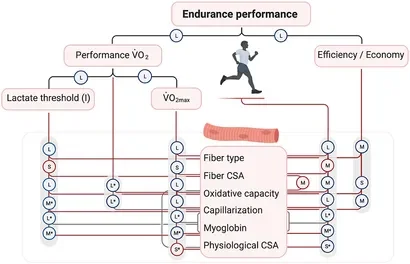
The first two are huge components of the usable energy production stuff described above. The third is also highly impacted by this capacity, but also by biomechanical and neuromuscular factors. Barnes and Kilding (2015) do a great job at getting into the weeds of this, they describe the impact of running economy as the bodies ‘ability to transfer power output to translocation’. They provide the following infographic to display this:
I think we can dilute this down to:
Movement skill
Running style/gait
Motor Programming/neural signaling
Force production
Muscle power
Lower leg stiffness and elastic recoil
If the cardiovascular and metabolic component described above is thought of as the energy deliverance system then these factors can be thought of as the energy usage system. This is how we convert energy (ATP) into movement in the mountains!
The Skill of Movement
Movement is a skill, requiring practice to produce the neuromuscular adaptations required to improve. The most optimal running technique is highly individual, often put down to a result of high volume training and a natural response of the body to find the path of least resistance. The research does seem to back this up which is interesting, although some playing about may be of use to ensure optimal efficiency. For example, stride length and rate are common variables to look at, with over-striding resulting in increased power demands and under-striding causing increased metabolic demands (Barnes & Kilding, 2015). However, most runners seem to naturally adopt the optimum here. To sum this up, unless you’ve got a specific reason then there’s little to say big deliberate gait changes to copy your favourite elite athlete are worth it. It is also worth noting that there are big alterations in gait once we start looking at changes in gradient during running (Vernillo et al., 2017).
This points to the importance of practicing the skill of running over the specific terrain that you need to perform on, perhaps even more important when we are looking at fell and sky-running. All this constitutes movement skill. So, get out and play!
The Force Required
The primary force producers are the skeletal muscles of the legs, with running going a long way to using all of them. Here’s a study by Hamner et al (2010) that shows this:

Figure 7. Taken from Muscle contributions to propulsion and support during running - PMC (nih.gov)
As is shown in figure 7, the largest moments (turning effect of a force) come in hip extension, knee extension and ankle plantarflexion, with moderate contribution of lumbar extension, hip flexion and hip abduction. During uphill running there is a relative increase in contribution from plantar-flexors (gastrocsoleus complex) and hip extensors (gluteul muscles) (Sloniger et al, 1997; Roberts & Belliveau 2005). Whilst during downhill running there is a large contribution of the knee extensors (quadriceps) (Lemire et al, 2021).
The force requirements during endurance events are sub-maximal due to limitations in the rate of usable energy production. As described above, this usable energy production is dominated by an oxidative process. Therefore, we must also look at oxidative capacity of the musculature and it’s efficiency at this work rate. The things that seem to impact this are outlined by the following, from Zwaard et al (2021):
Within this, ‘fibre type’ refers to categories of muscle fibres with certain characteristics. These all lie on a continuum, loosely defined as slow to fast twitch.
Type 1 (pure) Slower twitch speeds with high resistance
Type 2a (pure): Fast oxidative glycolytic, moderate twitch speeds with moderate fatigue resistance
Type 2x (pure): Fast glycolitic, fast twitch speeds with low fatigue resistance
Hybrid: These fibres essentially fill the gaps between the above types
Within elite endurance athletes there appears to be a higher proportion of type 1 muscle fibres, with the opposite true for sprint athletes (Plotkin et al, 2021). Importantly for us, it seems to be possible to shift along this continuum, between ‘hybrid’ and ‘pure’, and also between types (Plotkin et al, 2021).
This is all well and good, but active muscle work only accounts for an estimated 76% of the total energetic cost of running. So, where does the rest come from (Riddick & Kuo, 2022)?
Energy loss through soft tissue dissipation
Energy storage and release through passive elasticity
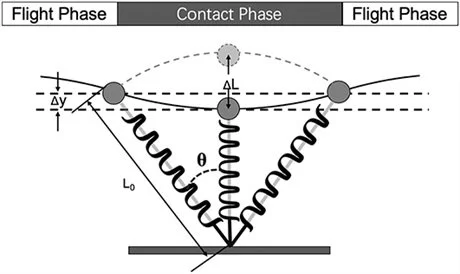
Figure 9 displays how this works. The passive elastic elements here are provided by non-contractile soft tissues, in the main:
Tendons
Tendon elastic strain energy accounts for 53% and 65% of the total force produced by the muscle tendon unit (MTU) of the soleus and gastrocnemius respectively (Lai et al, 2014)
Fascia
A general term for connective tissue found throughout the body, it helps to connect, seperate and support different structures
The infamous iliotibial band (IT band) is an example that may store and release elastic energy during running. Although much less than tendons, roughly 14% of that stored in the achilles tendon for example (Eng et al, 2015)
The process of strain and release of the muscle tendon unit during running forms part of a process called the stretch shortening cycle (SSC) and is a product of (Turner & Jeffreys 2010):
Musculotendinous stiffness
Isometric muscle pre-contraction (think tensing up your muscles)
Tendon stiffness
Elastic Recoil
Elastic energy stored and released in tendons
A smaller contribution from elasticity of the fascia (e.g the infamous IT band)
Rate of reactive force development
Development of an ‘active state’
Pre-contraction of muscles taking slack out of the system
Conclusion
So, after all that we can say that the key components of performance in endurance mountain running are:
Where does the energy come from?
The Cardiovascular and Metabolic Component
Aerobic capacity
Fuel Deliverance
Oxygen
Blood flow
Haemoglobin concentration (carriers of oxygen in the blood)
Lung capacity
Carbohydrate
Muscle glycogen
Fat
Muscle triglycerides
Plasma free-fatty-acids (FFA)
Engine Size
Vascularisation (blood-flow)
Myoglobin concentration (carriers of oxygen within the muscle)
Mitochondrial density (sites for aerobic respiration)
The Skill of Movement
Highly individual
Motor programming
Personal experimentation
Specific practice
The Force Required
Active muscle work
Hips, knees and ankles, especially into extension and plantarflexion!
Strength
Fatigue resistance
Reactive force development
Stiffness from isometric pre-contraction (tensing up)
Passive work
Elasticity in tendons and other soft tissues
Tendon stiffness
From this research and the personal experience highlighted (before you were bored to death reading through this page), we can work out the areas in which we would like to train.
Links to references:
Training for the Uphill Athlete | Uphill Athlete
Pathways of Human Metabolism Map – Stanford Med Education.
Romjin et al (1993) Regulation of endogenous fat and carbohydrate metabolism in relation to exercise intensity and duration - PubMed (nih.gov)
Mezzani (2017) Cardiopulmonary Exercise Testing: Basics of Methodology and Measurements | Annals of the American Thoracic Society (atsjournals.org)
Rodriguez-Marroyo et al (2018) Physiological demands of mountain running races | Semantic Scholar
Heinrich et al (2012) Effects of individual aerobic performance on finish time in mountain running - PubMed (nih.gov)
Barnes & Kilding (2015) Running economy: measurement, norms, and determining factors | Sports Medicine - Open | Full Text (springeropen.com)
Vernillo et al (2016) Biomechanics and Physiology of Uphill and Downhill Running | Sports Medicine (springer.com)
Hamner, Seth & Delp (2010) Muscle contributions to propulsion and support during running - PMC (nih.gov)
Zwaard, Brocherie & Jaspers (2021) Frontiers | Under the Hood: Skeletal Muscle Determinants of Endurance Performance (frontiersin.org)
Hargreaves & Spriet (2020) Skeletal muscle energy metabolism during exercise | Nature Metabolism
Ramos-Campo et al (2016) Muscle damage, physiological changes and energy balance in ultra-endurance mountain event athletes (ucam.edu)
Lazzer et al (2012) The energetics of ultra-endurance running - PubMed (nih.gov)
Barnes & Kilding (2015) Running economy: measurement, norms, and determining factors | Sports Medicine - Open | Full Text (springeropen.com)
Lemire et al (2021) Frontiers | Level, Uphill, and Downhill Running Economy Values Are Correlated Except on Steep Slopes (frontiersin.org)
Sloniger et al (1997) Lower extremity muscle activation during horizontal and uphill running | Journal of Applied Physiology
Roberts & Belliveau (2005) Sources of mechanical power for uphill running in humans - PubMed (nih.gov)
Riddick & Kuo (2022) Mechanical work accounts for most of the energetic cost in human running | Scientific Reports (nature.com)
Lai et al (2014) Tendon elastic strain energy in the human ankle plantar-flexors and its role with increased running speed - PubMed (nih.gov)
Eng et al (2015) The capacity of the human iliotibial band to store elastic energy during running - ScienceDirect
Turner & Jeffreys (2010) The Stretch-Shortening Cycle: Proposed Mechanisms and Method... : Strength & Conditioning Journal (lww.com)